Trading Academy
Master technical analysis one concept at a time.
Card 1 of 4
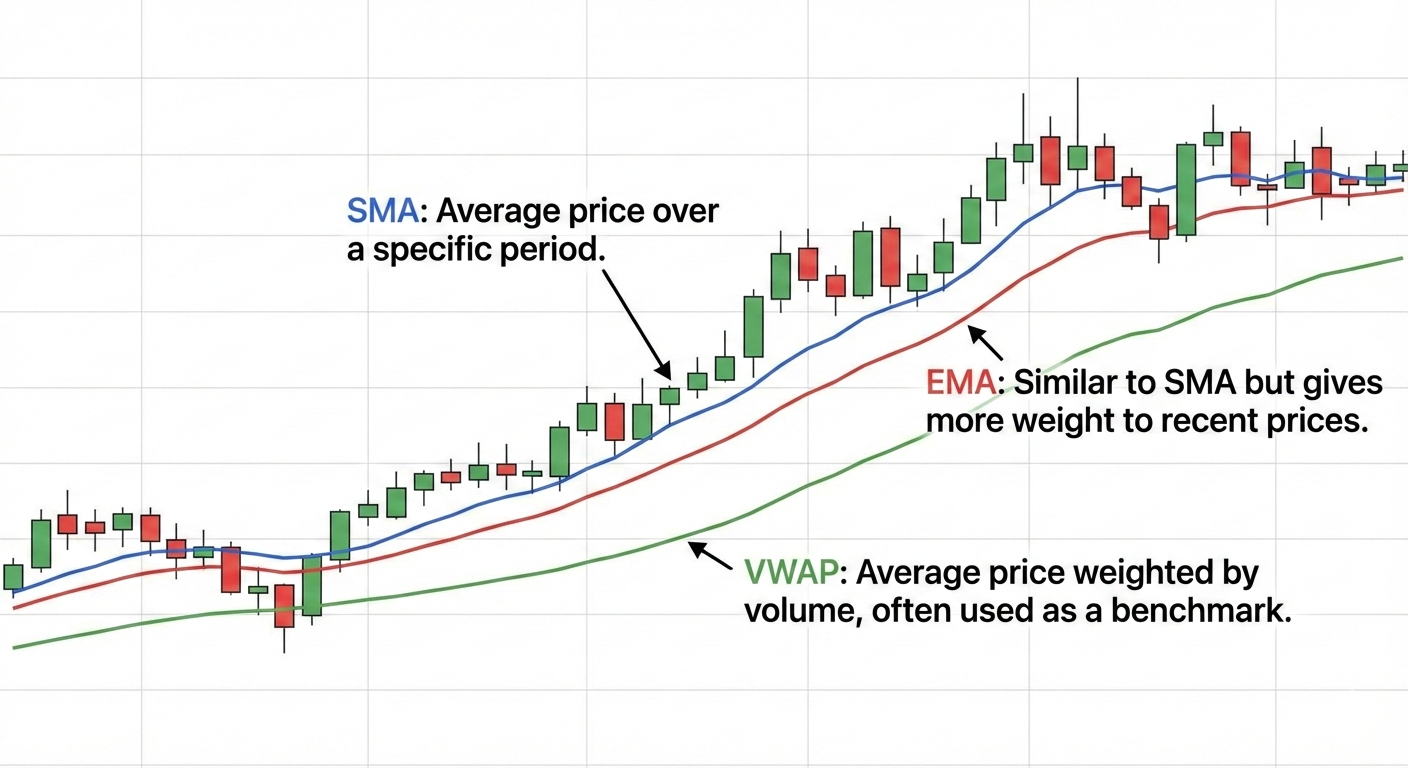
Moving Averages & VWAP
SMA = (P₁ + ... + Pₙ) / n
EMA = (Price × k) + (Prev EMA × (1 − k))
VWAP = Σ(Price × Volume) / Σ(Volume)
EMA = (Price × k) + (Prev EMA × (1 − k))
VWAP = Σ(Price × Volume) / Σ(Volume)
- SMA: Smoothes price data to show long-term trends.
- EMA: Reacts faster to recent price changes (better for day trading).
- VWAP: Used by institutions; represents the true average price weighted by volume.
- Trading Signal: Price > VWAP is typically bullish; Price < VWAP is bearish.
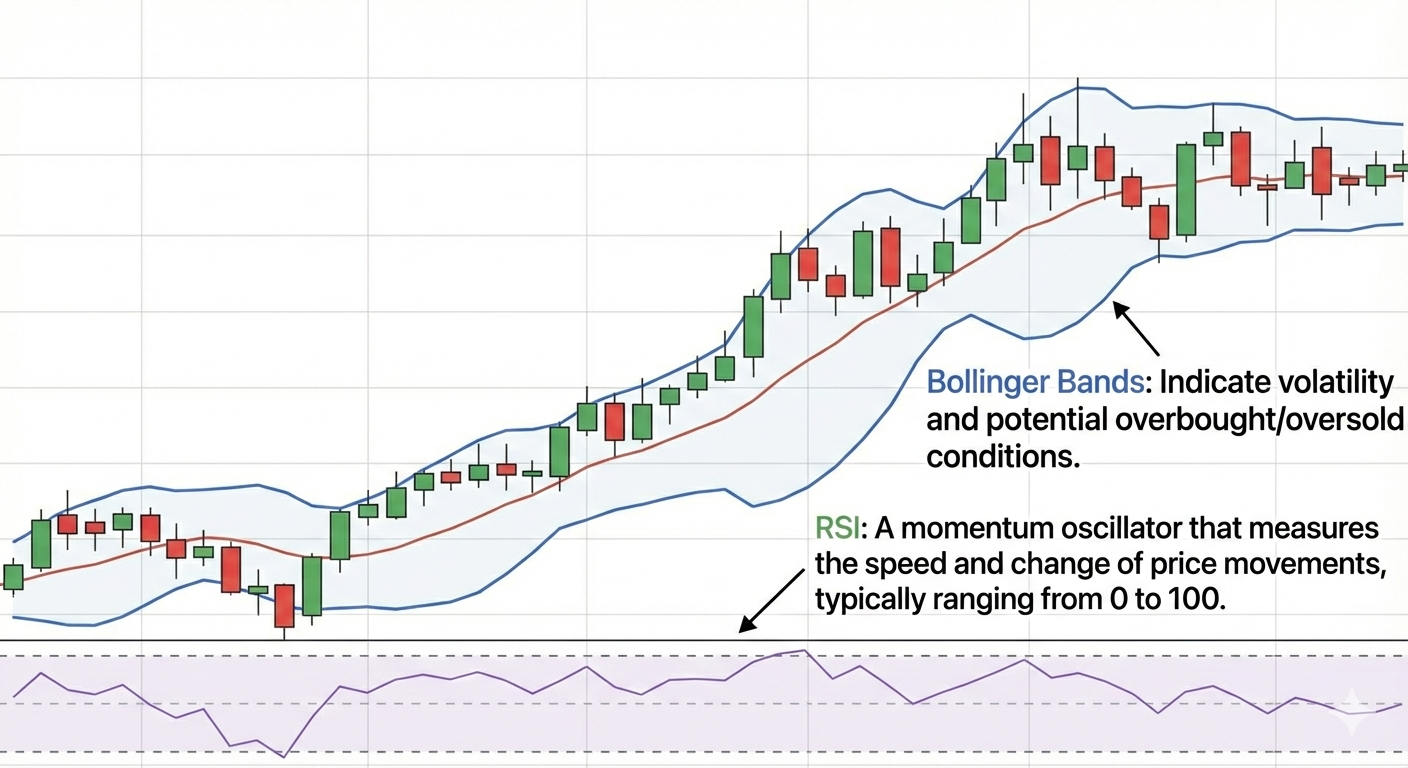
Bollinger Bands & RSI
Upper Band = SMA + (2 × Std Dev)
Lower Band = SMA − (2 × Std Dev)
RSI = 100 − [100 / (1 + RS)]
Lower Band = SMA − (2 × Std Dev)
RSI = 100 − [100 / (1 + RS)]
- Bollinger Bands: Measure volatility. Expanding bands = high volatility.
- Squeeze: Contracting bands often precede a major breakout.
- RSI > 70: Overbought (Potential reversal down).
- RSI < 30: Oversold (Potential bounce up).
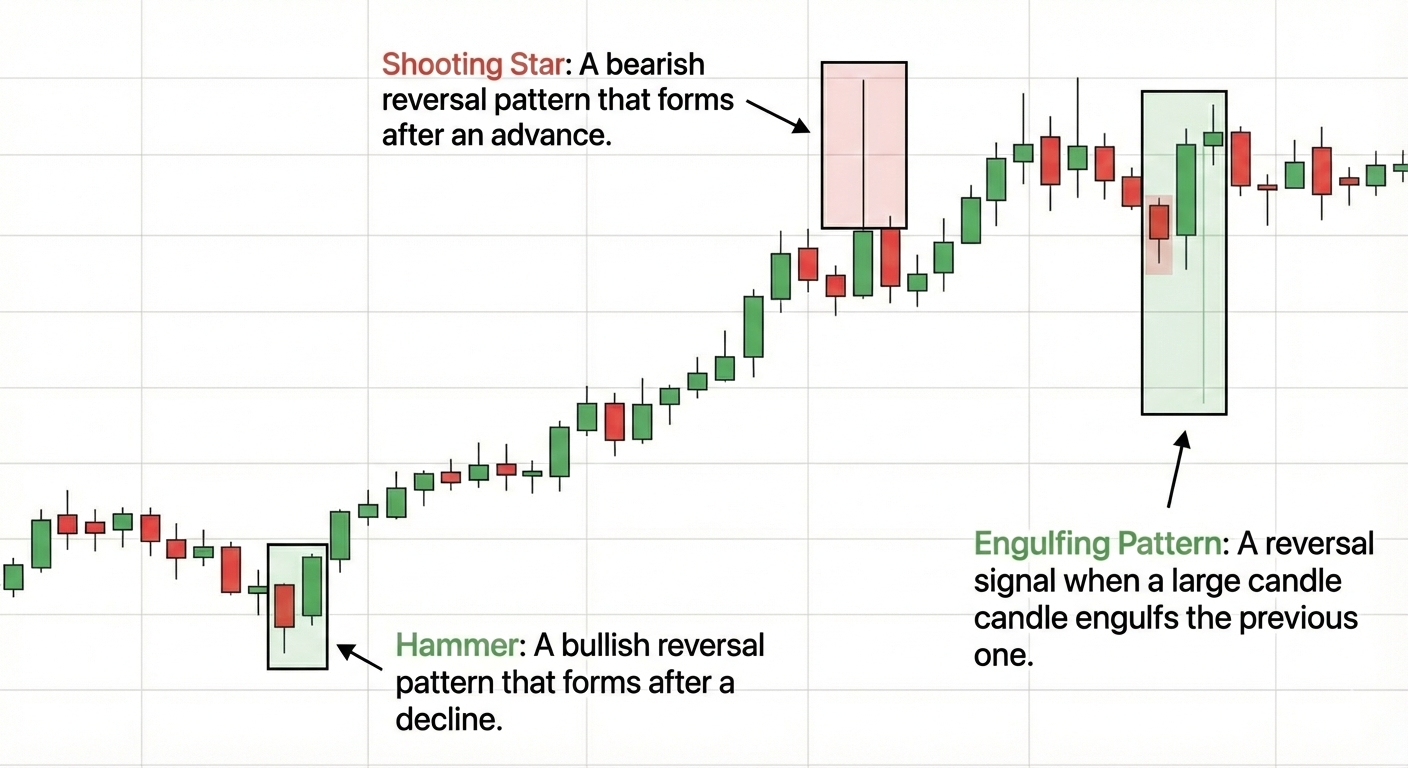
Candlestick Reversals
Logic: Rejection of Price Levels
Context: Look for these at Support/Resistance
Context: Look for these at Support/Resistance
- Hammer: Long lower wick after a downtrend. Buyers are stepping in.
- Shooting Star: Long upper wick after an uptrend. Sellers are rejecting high prices.
- Bullish Engulfing: A large green candle completely consumes the previous small red candle.
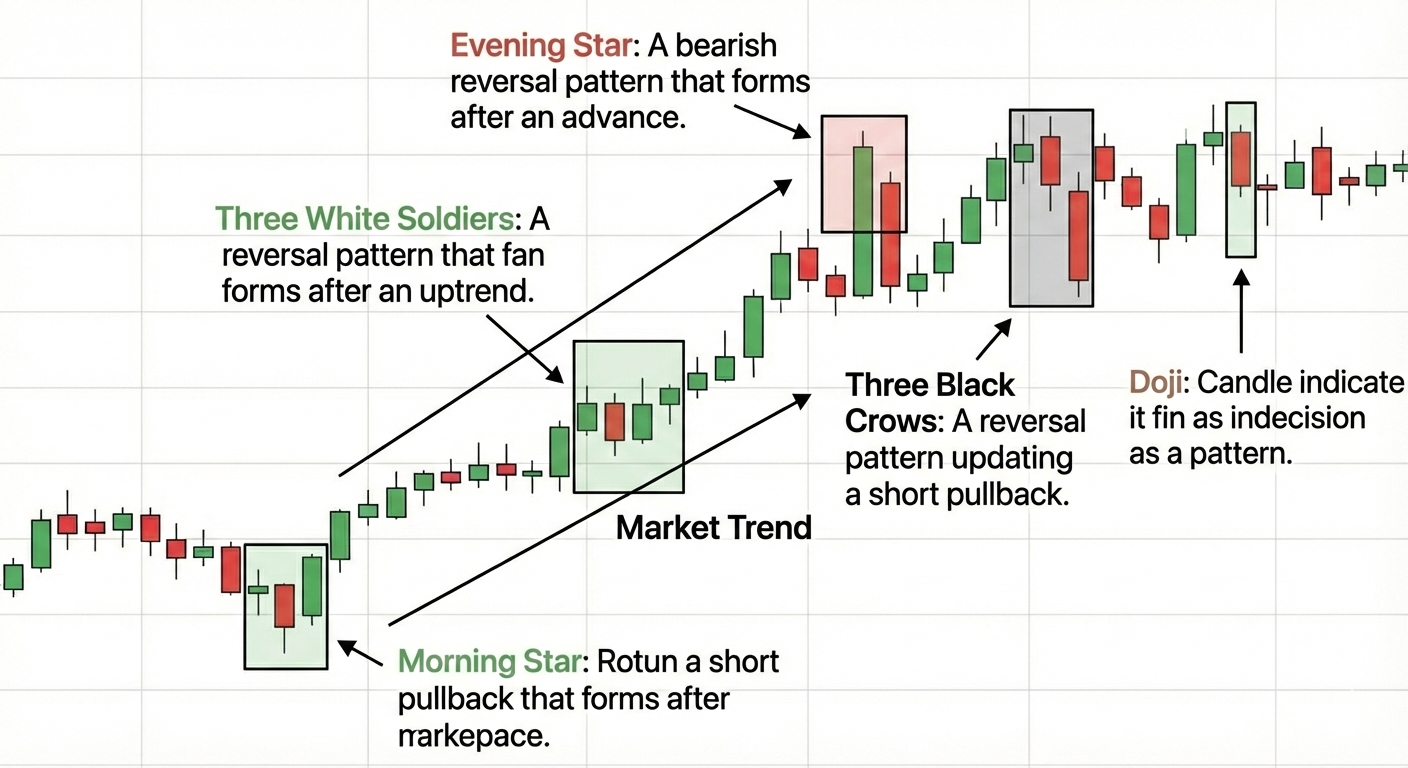
Market Trends & Patterns
Trend = Direction of Highs & Lows
Uptrend = Higher Highs + Higher Lows
Uptrend = Higher Highs + Higher Lows
- Morning Star: 3-candle pattern signaling a bottom (Bearish -> Indecision -> Bullish).
- Three White Soldiers: Three consecutive strong green candles (Continuation).
- Doji: Looks like a cross. Represents market indecision and potential reversal.